
GUI
The GUI is Aiur's browser interface for supervising a run. It combines the live fleet, durable decisions, recorded outcomes, provider meters, Build Orders, and analytics.
Open the GUI
| Launch condition | GUI result |
|---|---|
| Normal foreground or headless run | Listener requested. |
--no-dashboard | Listener disabled. |
| Writable mode | On loopback it binds without credentials and fails closed; beyond loopback it refuses to start without both credentials. |
| Read-only loopback | Requires credentials for access. Without them the listener may bind, but every request is refused until both credentials are set. |
| Host selection | server.host wins over the 127.0.0.1 default. |
Startup prints the URL and effective bind only when the listener runs:
Dashboard: http://127.0.0.1:4000 (bind host=0.0.0.0, port=4000)Find a surface
Use the browser when you need interactive detail; use the paired command when terminal output is more useful.
| GUI label | Route and purpose | CLI counterpart |
|---|---|---|
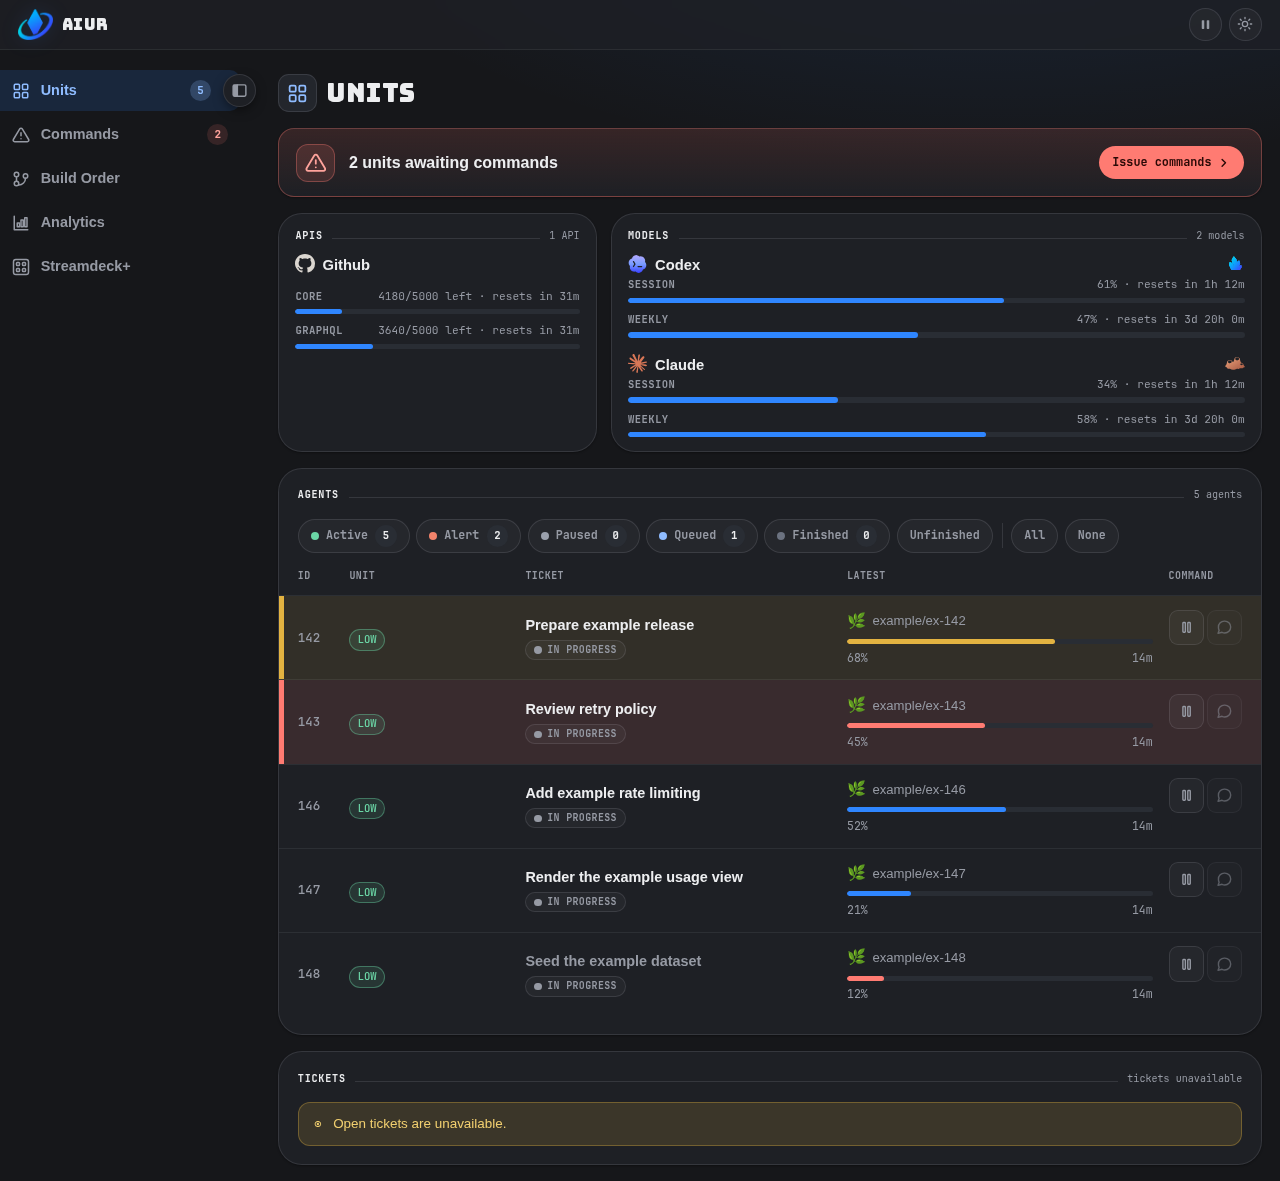
| Units | / is the Units fleet table and its filters, plus the Tickets panel of every open ticket; Units describes this surface. | aiur units |
| Commands | /commands is the durable decision inbox and each decision's detail. | aiur commands |
| Build Order | /build-orders is the Build Order catalog and one root's execution detail. | aiur build-orders |
| Analytics | /analytics is latest-run telemetry with durable restart fallback and an optional Build Order scope. A source line labels the data as the live boot or a retained prior run and shows how long ago it was observed. | aiur analytics |
| GitHub cache | /github-cache is a read-only inspector for the shared GitHub state cache. | none |
| Streamdeck+ | /streamdeck is the browser emulator for the physical Stream Deck + sidecar. | none |
| Route change | Behavior |
|---|---|
/commands and /commands/:decision_id | Current Commands inbox and detail URLs. |
/decisions and /decisions/:decision_id | Redirect permanently to the /commands equivalents. |
/api/v1/decisions, decision_id, event topics | Keep the decision vocabulary for compatibility. |
The operator-facing UI and CLI call these records Commands.
GUI data tables sort by their meaningful column headings. The first click sorts descending, the second reverses the order, and the active heading shows its direction. Icon and action columns are not sortable.
The sort query parameter preserves the selected table, column, and direction in copied or refreshed URLs. Paginated and progressively revealed tables sort the displayed rows, then reapply that order when more rows appear.
The pages
Each page renders a durable concept whose detail lives in Concepts.
| Page | Concept detail |
|---|---|
| Units | Fleet, tickets, and meters. |
| Commands | Issues agents flag for the Executor. |
| Build Order | Planning packs, phases, lanes, and dependencies. |
| Analytics | Lifecycle time, CPU, memory, whole-host fleet/build pressure, concurrency, and cost; missing telemetry stays explicit. |
| GitHub cache | What the shared GitHub state cache holds right now, and which writer put it there. |
Read fleet and build pressure
Analytics records fleet and build-gate whole-host sources alongside daemon process telemetry. The pressure chart shows occupied agents, configured/max/effective agent capacity, active and queued builds, and the oldest live build wait.
Its source state strip and timestamped data table distinguish current, stale, degraded, partial, and empty observations. The table additionally reports the binding admission signal and the measured load against its threshold, so a growing build queue with load far below threshold reads as build-gate-saturated rather than host-saturated.
A gap means the source was not current enough to support that value; it is never silently plotted as zero. Build-queue wait is the oldest waiter still live at the sample time, not a completed-build latency. These measurements expose when the build gate is the fleet constraint; they do not automatically change the agent cap.
The build-gate scan runs on a reduced cadence and carries the last observation forward, so measuring the gate never perturbs a real build acquisition.
GitHub cache
Aiur reads GitHub state through one shared store. Webhook deliveries, Aiur's own mutations, need-driven fetches, and the safety sweep all write to it, and every consumer reads it before spending a token. /github-cache shows what that store currently holds.
The page is strictly view-only. There is no refresh, no invalidate, no eviction and no fetch-now.
That is the store's own rule applied to its inspector: looking at cached state never costs a GitHub call, so a page that could trigger a fetch would break the property it exists to demonstrate.
Truly outdated bodies do not linger: the store's own sweep drops a cached body once it is past the 72-hour retention window, and deletes the whole entry only when the entry itself has had no write in that window — so expired rows clear themselves rather than accumulating, while a still-live processed mark or validator survives the body.
Its headline tile, Fetches caused by viewing, counts GitHub requests whose request chain began in a LiveView process. Merely opening or navigating the cache inspector leaves it at 0; operator actions on other pages that intentionally fetch fresh detail can raise it.
Caller names are shown separately and do not determine this count. Beside it the page prints how many calls the quota meter attributed in total, so a zero reads as a measurement rather than a reassurance.
The What is spending the budget table ranks each observed caller by the points that reached GitHub in the current rate-limit window. Its ReadCache served free column adds context from ReadCache only: caller-wide reads answered since this daemon boot.
Read the column as follows:
- A positive read count means low spend may be the cache doing its job.
- none this boot means
ReadCacheobserved the caller but served no reads. - N reads not deposited means the caller's reads reached the cache but its responses were not written into it — a failed or partial GraphQL response, or the entry ceiling. The gap between a caller's misses and deposits lives here.
- A policy refusal means the caller reached
ReadCachebut was deliberately not cached. - not observed by ReadCache means the caller did not reach that store.
- cache unavailable means there is no cache measurement.
None of the non-count states is rendered as a bare zero.
Served-free reads cost no GitHub budget. They are shown alongside the ranking for diagnosis, but are excluded from points, calls, rates, shares, charts, attributed totals and outside-spend figures.
Cache counters do not identify a GitHub budget, so callers seen only by the cache are not assigned to the GraphQL or core table.
Reads served by ResourceStore are also outside this column. The header explicitly names ReadCache, so absence from one store is not presented as absence from every shared-state path.
The Agent gh exact-shape hit rate tile measures the separate cache used by agent gh subprocesses.
It shows hits / (hits + misses) plus the raw counts for the previous 24 hours across agent workspaces on the daemon host; remote SSH workers are outside that coverage.
Missing counters and a zero denominator read Not measured, never 0%, and skipped or malformed sources are labeled as partial coverage.
It updates live. The page subscribes to the store's own change events, so a webhook delivery or an agent mutation landing is visible arriving — the row that changed flashes — without polling anything.
Three layers, each addressable and each reachable from the one above:
| Layer | Route | Shows |
|---|---|---|
| Map | /github-cache | Every resource type as a tile, sized by how many entries it holds and tinted by how old its worst entry is. |
| Group | /github-cache/:resource_type | That type's entries, searchable by identity and filterable by freshness, writer and body state. |
| Entry | /github-cache/:resource_type/:identity | One record in full: key, fetched_at, processed version, body version, ETag, last writer, and the cached body. |
Above the map, two history charts show the same cache as a time-series rather than a snapshot:
| Chart | Shows |
|---|---|
| Entries over time | Total entries, how many hold a body, how many are validator-only — so a cache that grew and then dropped reads as a shape. |
| Freshness over time | The same totals stacked by freshness (fresh / older / expired / unknown) — so a cache quietly aging is a band that grows, not a number to compare. |
The charts are fed by a sampler that reads the same store the page reads — never GitHub — every 30 seconds and keeps a bounded, in-memory ring of the last hour.
The ring starts again at each daemon boot, and the page says so, because drawing a flat zero over a span the sampler never observed would be the same silent-subset lie the rest of the page refuses. When the ring is too new to draw, the page says it is collecting.
Filters are carried in the query string, so a filtered view such as /github-cache/issue_comment?writer=webhook can be pasted into a ticket as evidence. A deep link to an entry keeps meaning the same thing after a restart, because the identity is the resource's own (type, owner, repo, id) rather than a position in a list.
The live budget map
Above the spend ranking, the budget map answers "who is calling, what stands in front of the call, and which pool pays" for the current run.
Every figure comes from local state — the quota meter, per-credential x-ratelimit-* headers, the broker admission ledger, the read cache, the resource store, the webhook registry, and the agents' agent-cache.tsv event files.
Opening and refreshing the page issues zero GitHub requests, and the admission count is unchanged by viewing.
Three identity meters show each configured credential's GraphQL and REST-core usage against its own limit, with the window reset time. A credential with no recent observation renders as stale with its age; it is never a zero standing in for unknown.
The caller → cache / store → pool table draws one edge per attributed caller, weighted by live volume and labelled with a verdict:
- free — reconciled 304s, git traffic, inbound webhooks.
- billed — metered spend with a reuse path: a stored body, an ETag, or a read-cache hit next cycle.
- wasted — no validator, no stored body, no reuse: the caller pays full price every cycle.
- unclassified — no evidence either way; never guessed.
A caller that consults neither cache layer is therefore visibly distinct from one that does, without reading the source.
The Broker admissions panel reads the rolling-hour ledger directly (billable vs 304-free, by consumer and family). The ResourceStore panel shows size, retention and per-type entries. The Webhook delivery panel shows each repo's delivery mode and freshness. The Agent-side cache panel shows per-workspace agent-cache.tsv hit rates.
Two caveats render next to the numbers they qualify.
REST spend cannot be attributed by caller — caller: is attached only on the GraphQL send path — so the core ranking shows one shared row rather than a partial ranking until that changes (#2298).
The broker books GraphQL-on-the-wire gh commands into core families, so a family split is not a budget split until that changes (#2297).
The section re-reads on the store's existing change channel and the quota sampler's cadence — no new timer, and none of it is a fetch.
Read "validator only, no body" carefully
An entry can hold an ETag and no cached body. That is a legitimate state: dropping a body deliberately keeps the validator, which still answers "has this changed?" cheaply.
It is not a cache hit. A consumer that sends that ETag is answered 304 with no data, so it spends a call and learns nothing. It has to re-read unconditionally instead.
The page shows those entries distinctly rather than as cached: their own count in the headline strip, their own filter, a marked row, and a none — validator only body cell. When a read you expected to be free still cost something, look here first.
Cached bodies are redacted on the way out and collapsed by default. A large store is truncated per resource type, with the number of undrawn entries stated rather than a subset shown as if it were everything.
Writable controls
| Writable control | Action |
|---|---|
| Unit | Pause or resume. |
| Command | Answer or revise. |
| Fleet | Adjust capacity. |
| Ticket | Apply routing labels. |
The CLI covers Unit and Fleet controls plus initial Command answers. Command revision and ticket-routing preview remain GUI-only today.
Disable mutations for an observation-only surface:
observability:
  dashboard_writable: false
Writable requests must also have the expected same-origin Origin or Referer and X-Aiur-Request: 1. These checks supplement authentication; they are not a reason to expose the dashboard publicly.
Authentication and network exposure
Browser access uses HTTP Basic Authentication configured through environment variables:
export AIUR_DASHBOARD_USERNAME=example-executor
export AIUR_DASHBOARD_PASSWORD='replace-with-a-strong-secret'
aiur
Aiur refuses to start a dashboard bound beyond loopback without both credentials. A loopback listener — writable or read-only — may bind without them, but its authentication plug fails closed and refuses every dashboard request until both credentials are set.
Put remote access behind a private network or trusted reverse proxy and use TLS there; Basic Auth does not encrypt transport.
The supervisor Decision API has a separate bearer credential, AIUR_SUPERVISOR_TOKEN. Generate one with openssl rand -base64 32, then put AIUR_SUPERVISOR_TOKEN=<generated-token> in ~/.aiur/.env for all projects or the repository .env for one project.
An exported value wins, then the global file, then the repository file. The token must be at least 32 bytes, bearer-safe, and free of surrounding whitespace. A present non-empty invalid value aborts startup, while an absent or empty value leaves the API disabled.
Dashboard credentials never grant machine-API authority, and the bearer token never signs a human browser action.