
Executor Control Center
The Executor Control Center is Aiur’s browser dashboard for supervising a run. It combines the live fleet, durable decisions, recorded outcomes, and telemetry entry point without turning the browser into a second source of truth.
Example data
Every screenshot on this page was captured from the shipped LiveView dashboard against an isolated fixture. Tickets (EX-142 and similar), agents, decisions, repositories, and links are synthetic.
Open the dashboard
Foreground runs always start the dashboard and bind it to loopback on a free port unless you choose a fixed port. Headless runs start it only when server.port or --port is a positive number. The launch output prints its URL when it is running:
observability:
  dashboard_writable: false

server:
  host: 127.0.0.1
  port: 4000
Keep the default loopback bind unless you deliberately need network access. See Authentication and network exposure before changing server.host.
Overview
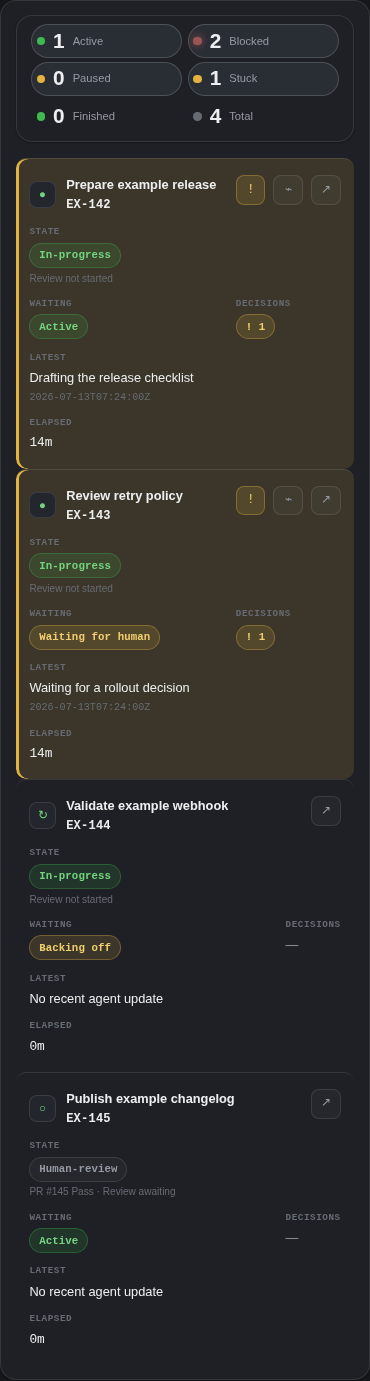
The overview gives the Executor a fast triage path: a blocking-decision banner, Fleet and Decision inbox tabs, and counts for active, blocked, paused, stuck, finished, and total tickets.


Decision inbox
The inbox at /decisions sorts durable decisions by blocking status, urgency, and age. Filters separate open, blocking, undelivered, supervising-Executor, resolved, and superseded records. Selecting a card opens its stable /decisions/:decision_id detail URL.


Decision card and detail
A decision card shows the ticket, source agent, urgency, authority, recommended option, and current lifecycle. The expanded detail adds the full context, consequence of delay, options, artifacts, lifecycle timing, and durable action controls.
When writes are enabled, a human Executor can:
- Answer an open decision with an option or bounded custom response.
- Retry delivery after a recorded answer has a retryable delivery failure.
- Revise a recorded answer. Revisions are append-only corrections; the original action stays in history.
- Handle a revision follow-up when a correction can no longer reach an active target.
The target agent, not the browser, records decision.acknowledged and decision.resolved after consuming and completing the active answer. A supervising Executor can also decide or revise through the separately authenticated machine API when policy permits; see Coordination and events.


Decision lifecycle
The stepper is a compact view over two canonical axes: decision state and delivery state. It never invents a transition.
| Display state | What it means |
|---|---|
| Recorded | The request is durable and still awaits an answer. |
| Dispatch pending | An answer is durable; delivery is queued or not yet confirmed. |
| Delivered | The active answer reached the target agent. |
| Acknowledged | The target emitted the correlated acknowledgement event. |
| Resolved | The target emitted the correlated terminal resolution event. |
| Delivery failed | Delivery failed and may be retryable; the answer remains durable. |
| Superseded | A newer append-only revision replaced an earlier action. |
Fleet table
The fleet combines running, retrying, and idle tracker-active tickets. Each row exposes work and waiting state, latest activity, elapsed time, decision count, CI/review facts, and safe links to the ticket, decision, or agent conversation. The filters are cumulative and the table becomes a card list at narrow widths.

Decision history
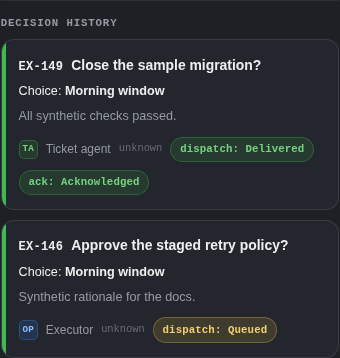
History is projected from the append-only decision audit. It attributes human Executor, supervising-Executor, ticket-agent, and system facts only when the canonical record identifies them. Dispatch, acknowledgement, revision, and follow-up results remain visible after the active card changes.

Recent outcomes
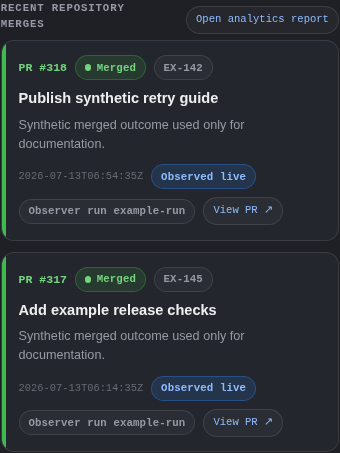
Recent outcomes come from the durable merge store, not a fresh GitHub poll on every render. Each card preserves repository, pull request, ticket attribution, observation source, and reconciliation health.

Analytics link
When a durable telemetry file exists, Open analytics report links to the separate /analytics surface. The Control Center summarizes live operational state; analytics remains a distinct offline report rather than being merged into that state model.


Read-only and writable modes
Read-only is the safe default. It keeps every projection and stable deep link visible while hiding decision, message, and pause controls.
Enable browser mutations explicitly:
observability:
  dashboard_writable: true
Writable requests must also have the expected same-origin Origin or Referer and X-Aiur-Request: 1. These checks supplement authentication; they are not a reason to expose the dashboard publicly.
Authentication and network exposure
Browser access uses HTTP Basic Authentication configured through environment variables:
export AIUR_DASHBOARD_USERNAME=example-executor
export AIUR_DASHBOARD_PASSWORD='replace-with-a-strong-secret'
aiur
Aiur refuses to start a writable dashboard, or a dashboard bound beyond loopback, without both credentials. A loopback read-only dashboard may run without them. Put remote access behind a private network or trusted reverse proxy and use TLS there; Basic Auth does not encrypt transport.
The supervisor Decision API has a separate bearer credential, AIUR_SUPERVISOR_TOKEN. Dashboard credentials never grant machine-API authority, and the bearer token never signs a human browser action.
Reproduce the screenshots
The checked-in capture command starts the real endpoint with isolated in-memory providers and captures only synthetic content:
cd website
npm ci
npm run shot:control-center
The fixture never reads a live repository, customer record, issue, agent transcript, or secret. Do not replace its example.test data with production data when updating these assets.